BlogsBlogs

Explore cutting-edge articles on laboratory products, industry innovations, and research trends with Lab Consulting.

Explore cutting-edge articles on laboratory products, industry innovations, and research trends with Lab Consulting.

How to Choose a Visual Inspection Device in 2026?

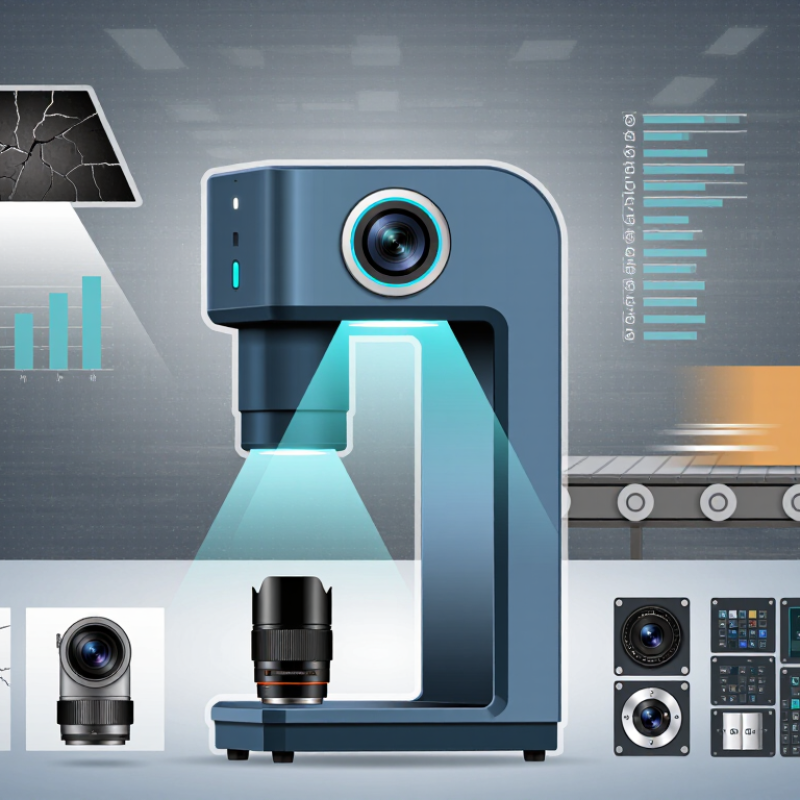
In 2026, choosing a Visual Inspection Device is less about buying the newest camera and more about matching its capabilities to a real inspection task. The right choice depends on what must be detected, how quickly parts move, and what errors would cost. Computer-vision pioneer David Marr wrote, “Vision is the process of discovering from images what is present in the world, and where it is.” That idea still matters when selecting inspection equipment. Small details matter.

Start with the defect, not the brochure. A hairline crack on a dark molded part may need different lighting and resolution than a missing label on a moving carton. Consider the material, surface finish, field of view, working distance, line speed, and available space. Check whether the device supports the required camera, optics, lighting, and software together. A high-resolution sensor can still miss defects when glare, vibration, or poor contrast distorts the image.

Ask for sample testing with your own parts, including acceptable and defective examples. Measure false rejects and missed defects across repeated runs, not just one polished demonstration. Also check setup effort, operator training, maintenance access, and integration with existing equipment. A useful warning: specifications rarely show the messiness of a production floor. It is easy to overlook dust, changing light, or inconsistent part positioning.

A reliable evaluation records test conditions and results, then compares devices against the same criteria. This guide explains how to define requirements, assess core features, test performance, and weigh total ownership costs. There may be no perfect device. The goal is a defensible choice that performs consistently in your actual working conditions.
How to Choose a Visual Inspection Device in 2026?

Set the Minimum Defect Size: Nyquist Sampling Requires at Least 2 Pixels

When choosing a visual inspection device, define the smallest defect that must be detected before comparing camera specifications. Nyquist sampling sets a basic threshold: that defect should span at least two pixels across its narrowest dimension. Two pixels is a floor, not a guarantee. A faint scratch may technically cover two pixels and still disappear because of blur, glare, or weak contrast.

Turn the defect size into a pixel target using the camera’s field of view. For example, a 100 mm-wide inspection area across 5,000 pixels gives 0.02 mm per pixel. A 0.1 mm flaw would span five pixels, giving the system more detail than the minimum. In practice, targeting three to five pixels across a defect can make detection more dependable, especially when edges are irregular. The right margin depends on the task.

Check the lens and lighting, too. A high-resolution sensor cannot recover detail that the optics blur or reflections hide. Test real samples at the intended working distance, with the planned exposure and motion speed. Inspect borderline defects, not just obvious ones. This part can be frustrating: a calculated pixel count may look adequate, yet the smallest flaw remains inconsistent in actual images. Recheck focus, contrast, and calibration before increasing camera resolution.

How to Choose a Visual Inspection Device in 2026? — Set the Minimum Defect Size: Nyquist Sampling Requires at Least 2 Pixels

Minimum Defect Size Theoretical Sampling Limit
(2 Pixels Across Defect)
Practical Target
(4 Pixels Across Defect)
Recommended Maximum Object-Space Pixel Pitch Approx. Maximum Horizontal Field of View
(1920 Image Pixels)
Selection Consideration
0.20 mm (200 µm) At least 2 pixels About 4 pixels 50 µm/pixel (0.05 mm/pixel) 96 mm Use finer object-space sampling if the defect has low contrast, irregular edges, or must be measured precisely.
0.50 mm (500 µm) At least 2 pixels About 4 pixels 125 µm/pixel (0.125 mm/pixel) 240 mm Check that the smallest defect remains visible across the full inspection area, including at the image edges.
1.00 mm (1,000 µm) At least 2 pixels About 4 pixels 250 µm/pixel (0.25 mm/pixel) 480 mm Confirm that the field of view covers the part while retaining enough pixels for reliable defect classification.
2.00 mm (2,000 µm) At least 2 pixels About 4 pixels 500 µm/pixel (0.50 mm/pixel) 960 mm A wider field of view may be possible, but verify detection performance with representative parts and lighting.

How to use this table: The Nyquist minimum is two samples across a feature; it is a theoretical sampling limit, not a guarantee of reliable detection. The practical examples use four pixels across the minimum defect as a planning target. Object-space pixel pitch is calculated as minimum defect size ÷ 4, and the example field of view is calculated as object-space pixel pitch × 1,920 pixels. These are estimates; lens distortion, focus, motion blur, sensor processing, lighting, contrast, and the inspection task can affect real-world performance. Validate the selected setup using representative defects.

Choose 2D or 3D Imaging Using ISO 10360-7 and ISO 25178

How to Choose a Visual Inspection Device in 2026?

Choose the imaging method by the feature you must measure. A 2D system suits flat parts, printed marks, and edge positions. It records length and width, but cannot reliably show surface height. ISO 10360-7:2011 describes acceptance and reverification tests for coordinate measuring machines with imaging probes. Its length-measurement and probing checks can guide verification when that setup matches your device. Don’t assume every camera system falls within its scope.

For dents, waviness, or surface texture, 3D imaging captures height across an area. ISO 25178-600:2019 defines metrological characteristics for areal topography measurement methods. Use it to assess whether a 3D instrument’s measurement performance fits the task. MarketsandMarkets’ 2023 Machine Vision Market report forecast growth from USD 12.1 billion in 2023 to USD 17.2 billion by 2028. That signals expanding adoption, not proof that 3D is right for every line. A polished scan can still hide poor calibration.

Tips: Check the smallest defect against your required uncertainty. Test a representative part, including its glare, coating, and edges. Keep the reference artefact nearby. Standards help; real parts can be less tidy.

Calculate Field of View and Pixel Scale Before Selecting Camera Resolution

How to Choose a Visual Inspection Device in 2026?

Before comparing camera resolutions, define the inspection area and the smallest feature that matters. Suppose a part spans 120 millimeters across the image, and the camera captures 2,448 horizontal pixels. Each pixel represents about 0.049 millimeters, or 49 micrometers, on the part. That is the pixel scale. A 0.2-millimeter defect would cover roughly four pixels, which may support detection but not dependable measurement.

Calculate field of view from the sensor size, lens focal length, and working distance, or measure it directly with a calibration target at the inspection plane. Then divide the field-of-view width by the image’s horizontal pixel count. Check the vertical direction too; the part may not fill the frame as expected. Keep some margin for positioning variation. Small detail matters.

Pixel counts alone can mislead. Focus, lighting, motion blur, lens distortion, and contrast all affect whether an edge is actually visible. A useful starting point is several pixels across the smallest feature, but measurement tasks usually need more than simple presence detection. The required number depends on the application, so test real parts under production lighting. A paper calculation can be reassuring—and still be wrong. Revisit the setup if results change across the image or between shifts.

How to Choose a Visual Inspection Device in 2026?

Calculate Field of View and Pixel Scale Before Selecting Camera Resolution

Example: For a 100 mm horizontal field of view, pixel scale equals field of view divided by horizontal image pixels. A 0.10 mm feature spans about 3 pixels when pixel scale is 33.3 µm/px or finer. The 3-pixel guide is a sampling reference, not a guarantee of detection; lens quality, focus, lighting, sensor cropping, and contrast also affect inspection performance.

Match Exposure Time and Frame Rate to Production-Line Throughput

Choose exposure time and frame rate from the fastest real production condition, not the average shift rate. The International Federation of Robotics’ World Robotics 2024 report recorded 541,302 industrial robot installations worldwide in 2023. That figure signals how widely automated production is expanding, but it does not specify an inspection camera’s required speed. Your line’s takt time and number of views per part do that. Measure at the part. At 120 parts per minute, one image per part requires at least 2 frames per second; four views require 8. Add headroom for spacing variation, trigger delays, and rejected frames. A starting allowance of 20–30% is practical, then test it on the actual line.

Exposure time controls motion blur. If a part moves at 1.2 metres per second, a 0.4-millisecond exposure produces about 0.48 millimetres of movement during capture. That may hide a small edge defect. Shorter exposure can reduce blur, but costs light and may reveal more sensor noise. Not a catalogue guess. Test with the smallest defect you must detect, under the dimmest expected lighting. Confirm image sharpness and processing time while the conveyor runs at peak speed. Leave margin. Real lines surge, vibrate, and stop unpredictably; an undersized buffer can lose images even when the camera’s headline frame rate looks sufficient. The right setting is the fastest exposure that still delivers usable detail, paired with a frame rate that keeps pace without starving downstream processing.

Validate Measurement Repeatability: AIAG MSA’s <10% GR&R Benchmark

How to Choose a Visual Inspection Device in 2026?
Validate Measurement Repeatability: AIAG MSA’s <10% GR&R Benchmark

A sharp image is not enough. A visual inspection device must return consistent measurements when the same part is checked again. AIAG’s Measurement Systems Analysis manual treats a GR&R result below 10% as generally acceptable. Results from 10% to 30% may be usable, depending on risk and application; above 30% is generally unacceptable. That makes the benchmark a practical screening tool, not a guarantee of quality.

Test with representative parts, operators, lighting, and the full measurement range. For example, repeatedly measure a small edge feature under the same setup, then repeat after changing operators. Keep the calculation basis clear: percent of study variation and percent of tolerance are not interchangeable. NIST/SEMATECH’s e-Handbook of Statistical Methods likewise emphasizes separating measurement-system variation from process variation. Record the actual readings, not just the final percentage.

I still find one point easy to overlook: a controlled trial can flatter a device. Dust, glare, fixture movement, or a slightly different camera angle may change results on the production floor. Run repeated trials across shifts and check the number of distinct categories; AIAG MSA guidance commonly uses five or more as a useful minimum. If results hover near 10%, investigate before treating the device as dependable. A borderline result deserves another test.

Newsletter

Subscribe to our newsletter and receive the latest news and exclusive insights every month. No spam.